Top React Developer Tools for 2025
Top React Developer Tools for 2025
React development in 2025 is all about performance, scalability, and maintainability. With React leading the web development landscape and trends like AI integration and React Server Components shaping workflows, here are the top tools you need to know:
- Redux Toolkit: Simplifies state management with tools like
createSliceandcreateAsyncThunk. - Recoil: Introduces atomic state units for better performance and modularity.
- Jotai: Lightweight state management focused on simplicity and fine-grained updates.
- MobX: Reactive state management with automatic dependency tracking.
- React Developer Tools: Browser extension for inspecting and debugging components.
- Why Did You Render: Detects unnecessary re-renders to optimize performance.
- Reactotron: Desktop debugger for React and React Native.
- React Profiler: Helps analyze rendering performance.
- Jest: Comprehensive testing framework for React applications.
- React Testing Library: Focuses on user interaction-based testing.
- Cypress: End-to-end testing tool for real browser environments.
- Storybook: Develops and tests UI components in isolation.
- ESLint: Ensures clean, error-free code with customizable linting rules.
- Prettier: Keeps code formatting consistent and automated.
- Vite: Speeds up builds with blazing-fast performance.
- Next.js: Enhances React with SSR, SSG, and ISR for optimized applications.
Quick Comparison:
| Tool | Primary Use | Key Feature |
|---|---|---|
| Redux Toolkit | State Management | Simplifies async logic with createAsyncThunk |
| Recoil | State Management | Atomic state model for modularity |
| Jotai | Lightweight State Control | Fine-grained updates, minimal API |
| MobX | State Management | Automatic dependency tracking |
| React Developer Tools | Debugging | Component inspection and real-time state editing |
| Why Did You Render | Performance Monitoring | Detects unnecessary re-renders |
| Reactotron | Debugging | Real-time insights for React Native |
| React Profiler | Performance Analysis | Measures rendering times and bottlenecks |
| Jest | Testing | Snapshot testing and built-in coverage |
| React Testing Library | Testing | User-interaction-focused testing |
| Cypress | End-to-End Testing | Real browser testing with time travel |
| Storybook | UI Component Development | Isolated component testing and documentation |
| ESLint | Code Quality Checker | AST-based analysis for React patterns |
| Prettier | Code Formatter | Automated consistent formatting |
| Vite | Build Tool | Fast builds with native ESM support |
| Next.js | React Framework | SSR, SSG, ISR, and API routes |
These tools are essential for modern React development, helping you build faster, cleaner, and more scalable applications.
How To Debug React Apps Like A Senior Developer
1. Redux Toolkit: Simplifying State Management
Redux Toolkit (RTK) is the official toolset for Redux that makes managing state in React apps much easier. It cuts down on repetitive code and improves both the quality and performance of your application [2].
What Makes Redux Toolkit Stand Out?
RTK provides a range of tools that simplify development:
- configureStore: Automatically sets up the Redux store with must-have middleware and integrates Redux DevTools.
- createSlice: Combines action creation and reducer logic in one step.
- createAsyncThunk: Makes handling asynchronous operations straightforward.
- Built-in Immer support: Allows you to write "mutable-looking" code while keeping updates immutable, adding just 3.3K (gzipped) to your bundle size [1][3].
Improved Performance and Workflow
RTK Query takes care of data fetching and caching for you. This means no more writing manual cache management or handling loading states yourself [2].
How It Compares to Traditional Redux
| Feature | Traditional Redux | Redux Toolkit |
|---|---|---|
| Store Setup | Manual middleware setup | Automatic with configureStore |
| Action Creation | Separate action types/creators | Combined in createSlice |
| Immutability | Manual state copying | Built-in with Immer |
| Async Logic | Custom middleware setup | Built-in createAsyncThunk |
Best Practices for Using RTK
To get the most out of Redux Toolkit, follow these tips:
- Organize your app using a feature folder structure.
- Keep Redux logic in single slice files for better clarity.
- Use React-Redux hooks like
useSelectoranduseDispatchto interact with the store. - Enable Redux DevTools to simplify debugging.
Redux Toolkit is an essential tool for developers building large, complex React applications in 2025. It saves time, reduces errors, and streamlines your workflow.
2. Recoil: Atomic State Management

Recoil stands out from traditional Redux patterns by introducing atomic state units and selectors, designed specifically for modern React workflows. It simplifies state management by breaking down complex states into smaller, independent pieces.
Key Concepts and Features
Recoil is built around two main ideas:
- Atoms: These are the smallest units of state. Components can subscribe to them directly.
- Selectors: These are pure functions that derive or transform state from atoms.
This atomic structure offers several advantages:
| Feature | What It Does | Why It Matters |
|---|---|---|
| Granular Subscriptions | Only updates components tied to specific state | Boosts performance in larger applications |
| React-like API | Familiar patterns, similar to useState |
Easier to learn and adopt |
| Built-in Async Support | Handles async operations natively | No need for extra middleware |
| Concurrent Mode Ready | Built for React's latest features | Prepares your app for future updates |
This approach ensures better rendering performance by limiting updates to only the components that rely on changed data.
Performance Optimization
Recoil enhances performance by making sure only those components tied to updated atoms are re-rendered. This keeps your app running smoothly, even as it scales.
Implementation Tips
Here are a few tips to get started:
- Organize Modularly: Group related atoms and selectors in separate files for cleaner, more maintainable code.
- Focus on Single Responsibility: Design atoms to manage specific pieces of state, keeping them simple and focused.
- Leverage Selectors: Use selectors for computed or derived values instead of creating extra atoms.
Developer-Friendly Design
"Recoil works and thinks like React. Add some to your app and get fast and flexible shared state" [4].
Best Practices for Integration
To make the most of Recoil, consider these strategies:
- Handle errors effectively in asynchronous selectors.
- Take advantage of Recoil's built-in caching to avoid redundant computations.
- Use Recoil DevTools for easier debugging.
- Provide fallback states to handle loading and error scenarios gracefully.
Recoil’s atomic model provides a powerful and efficient way to manage state in modern React applications.
3. Jotai: Lightweight State Control
Jotai is a state management library for React that focuses on simplicity and performance, all within a compact 3.9 kB bundle size [6].
Key Features
Jotai's design prioritizes ease of use, offering an intuitive API that eliminates unnecessary boilerplate. Its atomic state model ensures efficient updates without adding complexity.
| Feature | Advantage | Impact on Development |
|---|---|---|
| Atomic State Model | Fine-grained updates | Minimizes redundant re-renders |
| React Context API Support | Smooth state propagation | Boosts application performance |
| TypeScript Compatibility | Strong type safety | Improves coding experience |
| Concurrent Mode Support | Ready for React's latest tools | Ensures future compatibility |
Performance Tips
- Organizing Atoms
Start with a single atoms.ts file for better structure. As your project scales, you can colocate atoms with their related components to keep things organized [9].
- Optimizing Renders
To enhance performance, use Jotai's specialized hooks:
// Use these instead of useAtom
const value = useAtomValue(myAtom);
const setValue = useSetAtom(myAtom);
This approach reduces unnecessary re-renders by separating read and write operations [8].
Best Practices for Integration
To make the most of Jotai in your React projects, follow these practices:
- Keep mutation logic within writable atoms to maintain clean separation of concerns.
- Use utilities like
selectAtom,focusAtom, orsplitAtomto avoid excessive renders [10]. - Create custom hooks for commonly used atoms to simplify repetitive state management tasks [9].
"Jotai: Offers a fine-grained and minimalistic approach, focusing on simplicity and performance. Great for managing both local and global state in a more modular way." - Dmitry Sky [5]
This focus on simplicity and efficiency sets Jotai apart from other state management tools.
How Jotai Stands Out
Jotai's minimal API and efficient design make it a strong choice in the React ecosystem. While Redux leads with 42.8M monthly npm downloads, Jotai's 4.5M monthly downloads [6] highlight its growing popularity.
Jotai operates with just five core methods (Object.keys(require("jotai")).length = 5) [7], keeping its API straightforward. This makes it ideal for projects where quick development and maintainability are key priorities.
For server-side rendering (SSR) setups like Next.js, Jotai integrates easily. By using its Provider component at the root level [8], you can ensure consistent state management throughout your app.
Jotai's design aligns with modern React practices, offering an efficient solution for scaling applications.
4. MobX: Observable State Handler
MobX offers a different take on state management compared to atomic state models like Recoil and Jotai. It stands out by using reactive programming to handle state updates automatically, making it a go-to choice for developers looking to simplify state management. Here's a closer look at MobX's standout features and how it works.
Core Features and Advantages
| Feature | What It Does | Why It Matters |
|---|---|---|
| Automatic Dependency Tracking | Handles subscriptions automatically | Cuts down on manual work |
| Direct State Mutation | Allows straightforward state changes | Speeds up development |
| Computed Properties | Automatically caches derived values | Improves performance |
| Flexible Architecture | Lets you organize code your way | Makes scaling easier |
Performance Optimization
MobX's reactive engine is smart - it tracks dependencies and updates only the components that need it. Say goodbye to manual performance tweaks [11].
To get the best performance, consider these tips:
- Wrap components accessing observable data with
observer. - Break your UI into smaller, focused components.
- Delay dereferencing observable values until inside
observercomponents. - Use computed values for derived state to avoid unnecessary recalculations.
Best Practices for Integration
For better debugging and maintainability, enable strict mode with this setup:
import { configure } from 'mobx';
configure({ enforceActions: 'observed' });
This ensures all state changes happen within actions, keeping your code predictable and easier to debug [12].
Organizing State with MobX
MobX gives you the flexibility to organize your state effectively. For example, you can use makeAutoObservable to create stores with minimal boilerplate:
import { makeAutoObservable } from 'mobx';

class UserStore {
  constructor() {
    makeAutoObservable(this);
  }

  users = [];

  addUser(user) {
    this.users.push(user);
  }

  get activeUsers() {
    return this.users.filter(user => user.isActive);
  }
}
Using MobX in Components
For managing local state within a component, the useLocalObservable hook is a handy tool:
const TodoComponent = observer(() => {
  const todo = useLocalObservable(() => ({
    title: '',
    completed: false,
    toggle() {
      this.completed = !this.completed;
    }
  }));

  return (
    // Component implementation
  );
});
Handling Side Effects
You can manage side effects effectively by combining autorun with useEffect:
useEffect(() => {
  const dispose = autorun(() => {
    // Side effect implementation
  });
  return () => dispose();
}, []);
This ensures proper cleanup when components unmount, helping you avoid memory leaks [13].
For server-side rendering, don't forget to call enableStaticRendering(true) to prevent issues with subscriptions [13].
5. React Developer Tools: Browser Extension
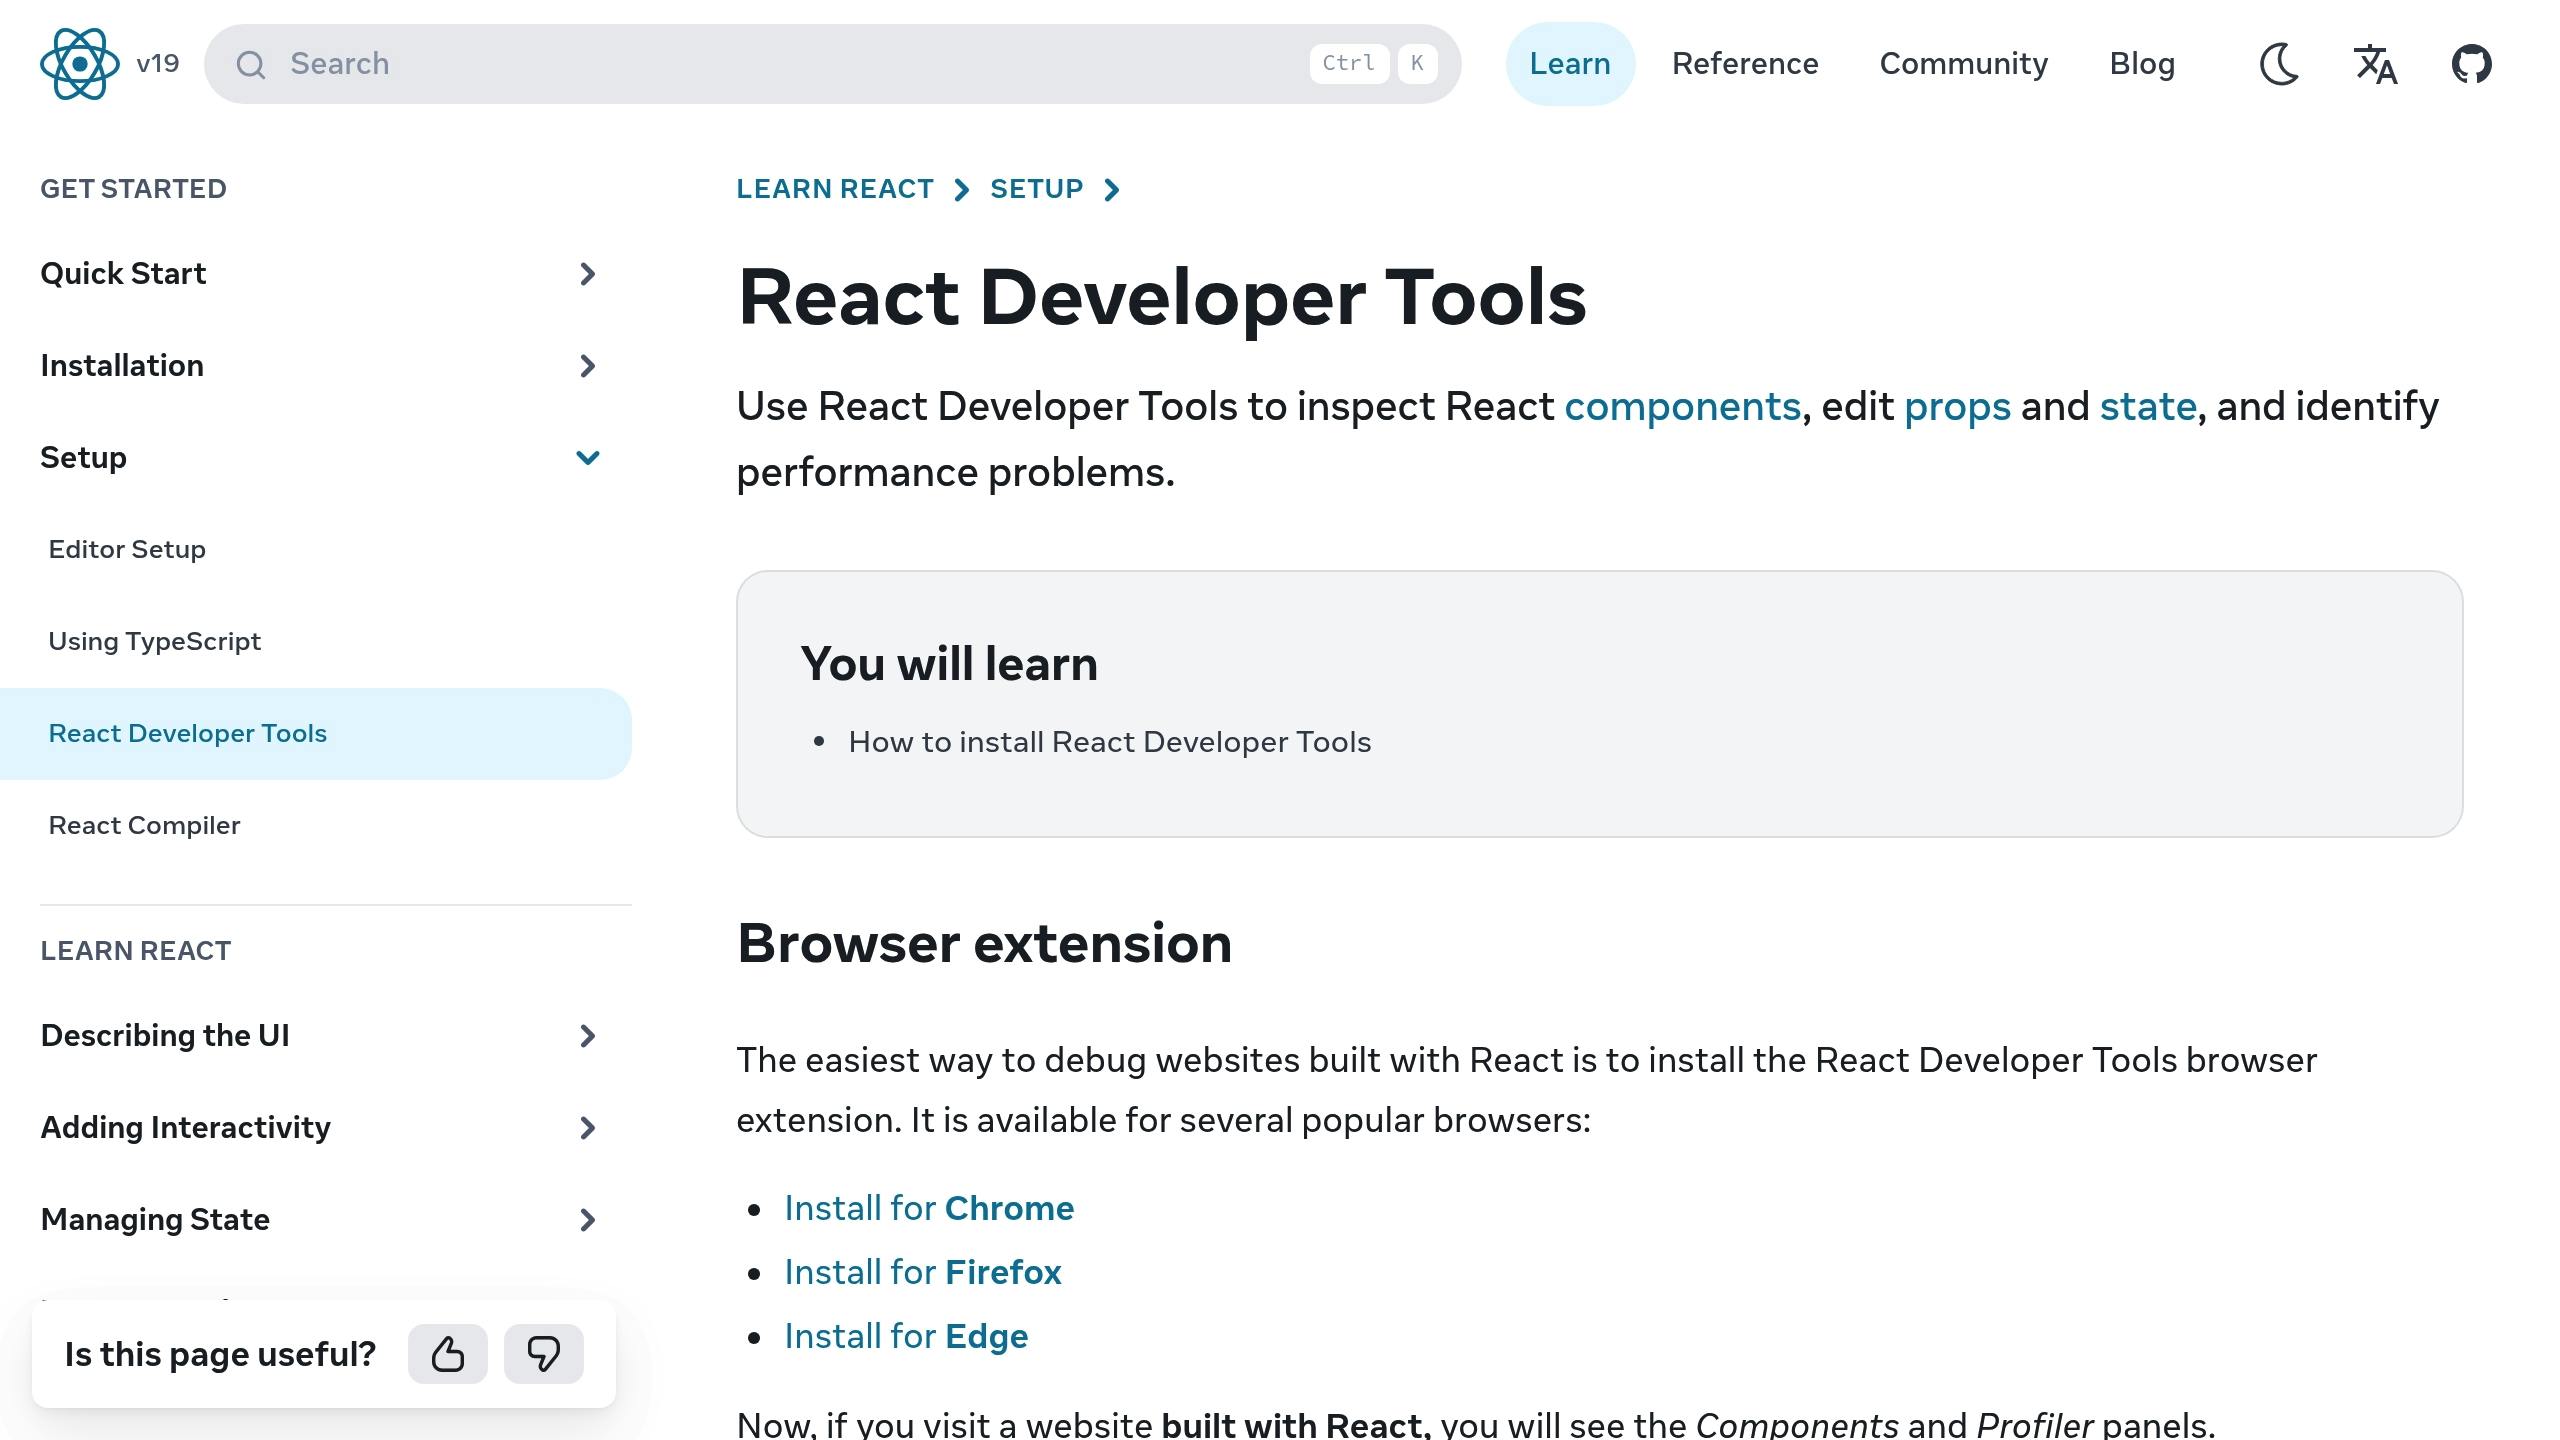
React Developer Tools is a popular browser extension for React developers, boasting over 4 million active users[14]. It enhances your browser's DevTools by adding two dedicated tabs: Components ⚛ and Profiler ⚛, designed to simplify component inspection and debugging.
Component Inspection Features
The Components tab gives you a clear view of your app's structure. With it, you can:
- Explore the component hierarchy visually.
- Inspect and modify props and state in real time.
- Highlight updated components automatically.
- Debug hooks and their dependencies.
- Search and filter components with ease.
These tools go beyond simple inspection, offering deeper debugging capabilities.
Debugging Tools
The extension includes several features to streamline debugging:
| Feature | What It Does | Why It Matters |
|---|---|---|
| Time-Travel Debugging | Lets you step through state changes chronologically. | Speeds up bug fixes. |
| Component Updates | Highlights components as they render. | Provides instant feedback. |
| State Manipulation | Enables real-time editing of props and state. | Speeds up prototyping. |
| Hook Inspection | Displays detailed hook dependencies. | Improves state management. |
These tools make identifying and resolving issues much more efficient.
Performance Insights with the Profiler
The Profiler tab focuses on performance analysis, helping you measure rendering times and identify bottlenecks. Note that this feature is disabled in production builds due to performance overhead. Use a profiling-enabled build for analyzing production environments[16].
New Features in Version 6.1.1
Version 6.1.1, released in February 2025[14], introduced several upgrades for better analysis:
- Rendered By List: Navigate the ownership hierarchy of components easily.
- Filter Preferences: Filters now persist between sessions for a smoother workflow.
- On-Demand Data Loading: Optimized handling of large component trees.
- Performance Metrics: Detailed rendering time breakdowns.
These updates provide deeper insights and streamline the development process.
Cross-Browser Compatibility
Chrome users can install the extension directly, while developers using other browsers can use the react-devtools npm package. This ensures similar functionality across different environments[15].
Tips for Effective Use
- Use the Components tab to explore your app's structure and relationships.
- Pinpoint performance bottlenecks with the Profiler.
- Take advantage of real-time state editing for quick testing.
- Set up persistent filters to focus on the components that matter most.
With its seamless integration into React's ecosystem, this extension is an indispensable tool for understanding and optimizing your application's behavior and performance.
6. Why Did You Render: Performance Monitor
Why Did You Render (WDYR) is a debugging tool popular among React developers, boasting over 11.7k GitHub stars as of February 2025 [17]. This library helps detect and notify developers about unnecessary re-renders in React applications.
Core Functionality
WDYR modifies React to provide detailed insights into how and why components re-render. It pinpoints specific props or state changes that trigger re-renders, even when values seem unchanged.
Practical Use Case
LogRocket (February 2025) highlighted a scenario where WDYR identified a performance issue. A 'Main' component was re-rendering with every scroll because of a constantly changing style prop.
Implementation Guide
| Step | Details | Notes |
|---|---|---|
| Installation | npm install @welldone-software/why-did-you-render --save-dev |
Use as a dev dependency only. |
| Configuration | Create a wdyr.js file and set it as the first import. |
Limit to development builds. |
| Component Setup | Enable trackAllPureComponents or mark specific components. |
Focus on selective monitoring. |
| Performance | Use only in development to avoid production overhead. | Avoid any production usage. |
Once installed, WDYR offers tools to track and debug components more effectively.
Advanced Features
The latest version, compatible with React@19 [17], introduces advanced debugging options for React and React Native. Developers can:
- Monitor custom hooks using
trackExtraHooks. - Automatically track all pure components.
- Identify specific props causing re-renders.
- Debug performance issues in complex component trees.
These tools enable developers to focus on optimizing specific areas of their applications.
Performance Debugging Tips
To get the most out of WDYR:
- Simulate Slower Devices: Use Chrome's Performance tab with CPU throttling to replicate issues more easily.
- Analyze Initial Load: Run WDYR during the initial page load to uncover potential bottlenecks.
- Target Specific Components: Focus on particular components instead of monitoring everything to keep debugging efficient.
Development Best Practices
Always configure WDYR as the first import in your project and ensure it’s only active in development builds. This prevents unnecessary overhead in production environments.
7. Reactotron: Debugging Platform
Reactotron, developed by Infinite Red, is a desktop debugger designed for React and React Native. It provides real-time insights into app behavior, offering a desktop-focused alternative to tools like React Developer Tools and Why Did You Render.
Core Features
| Feature | Capability | How It Helps |
|---|---|---|
| State Monitoring | Tracks Redux state in real time | No need to enable debug mode |
| Network Tracking | Monitors API requests and responses | Simplifies API debugging |
| Performance Tools | Includes benchmarking utilities | Speeds up performance checks |
| Storage Access | Inspects Async Storage and MMKV | Visualizes stored data directly |
| Design Tools | Provides image overlay options | Ensures precise design alignment |
How to Set It Up
- Install Reactotron with this command:
yarn add reactotron-react-native @react-native-async-storage/async-storage - Create a
ReactotronConfig.jsfile in your project root and import it into yourindex.js. - Start your app, and view live data through the Reactotron desktop app.
Advanced Features
Reactotron goes beyond browser-based debugging by offering a desktop interface for deeper analysis. It supports plugins to expand its functionality and allows you to inspect Redux state without relying on debug mode.
Why It Stands Out
Reactotron doesn't slow down your app because it operates independently of debug mode. This makes it perfect for performance-critical testing and debugging tasks.
Real-World Uses
With Reactotron, you can:
- Overlay design mockups to check layout accuracy.
- Benchmark app performance.
- Dispatch Redux actions manually for testing.
- Monitor Async Storage changes in real time.
"Reactotron is an invaluable tool for any React Native developer who wants to gain deep insights into their app's behavior. It enhances the development experience by offering real-time debugging, easy state inspection, and error tracking." - Shiv Tiwari [18]
Its ability to inspect Redux store and MMKV storage makes Reactotron a must-have tool alongside other React development resources in 2025.
8. React Profiler: Performance Analysis
The React Profiler helps you analyze rendering performance and identify bottlenecks in your component tree. It’s a handy tool for improving your app's efficiency by focusing specifically on render-related issues.
Core Functionality
The Profiler provides several metrics to help you measure and optimize rendering:
| Metric | Description | Usage |
|---|---|---|
| Actual Duration | Time spent rendering the profiled components | Pinpoints slow renders |
| Base Duration | Estimated worst-case render time | Highlights optimization areas |
| Commit Time | Time when the update was committed | Tracks render timing |
| Phase Type | Specifies mount or update phase | Differentiates render types |
| Start Time | When rendering began | Tracks render initiation |
How to Use It
The Profiler requires two key props:
id: A unique string to identify the component tree being profiled.onRender: A callback function that collects performance data likeid,phase,actualDuration,baseDuration,startTime, andcommitTime.
Here’s an example implementation:
<Profiler id="MainView" onRender={(id, phase, actualDuration) => {
  if (actualDuration > 10) {
    console.warn(`Slow render detected in ${id}: ${actualDuration}ms`);
  }
}}>
  <MainComponent />
</Profiler>
Advanced Features
React Profiler allows you to profile nested sections of your application. This means you can measure specific components or areas independently, giving you detailed insights into performance issues.
Things to Keep in Mind
Using the Profiler does introduce some overhead. To avoid affecting your users, make sure to use a production profiling build [19] when analyzing performance in a live environment.
Best Practices
- Focus on specific components to understand render patterns and compare metrics.
- Pay attention to components where the actual duration is noticeably higher than the base duration.
- Use multiple Profiler instances to narrow down performance issues in different parts of your app.
Common Issues the Profiler Can Catch
The React Profiler is great for spotting problems like:
- Extra re-renders in large component trees
- Time-consuming calculations during renders
- Inefficient hook dependency arrays
- State updates causing unnecessary render chains
sbb-itb-2612284
9. Jest: Testing Framework
Jest is a widely-used testing framework for React applications, boasting over 50 million downloads [21]. Developed by Facebook, it offers an all-in-one testing solution tailored for React projects, requiring little to no setup.
Core Features
Jest simplifies testing by bundling key features into a single platform:
| Feature | Description | Why It Matters |
|---|---|---|
| Zero Config | Works out of the box with Create React App | Start testing immediately |
| Snapshot Testing | Captures UI component renders | Keeps UI behavior consistent |
| Parallel Execution | Runs tests in isolated environments | Speeds up test completion |
| Built-in Coverage | Tracks test coverage | Helps monitor code quality |
| Watch Mode | Runs tests automatically on file changes | Provides instant feedback |
Writing Effective Tests
Here's a simple example of a Jest test:
import { render, screen } from '@testing-library/react';
import UserProfile from './UserProfile';

test('renders user profile with correct name', () => {
  render(<UserProfile name="John Doe" />);
  expect(screen.getByText('John Doe')).toBeInTheDocument();
});
Jest also supports snapshot testing, which ensures your UI remains visually consistent over time.
Advanced Testing Capabilities
Snapshot testing goes beyond basic functionality checks by locking in the visual state of components. This helps identify unintended changes. As Tech Lead Jagroop Singh puts it: "Writing unit tests not only catches hidden bugs early but also boosts long-term development speed and confidence" [20].
Performance Considerations
Jest’s test isolation ensures that each test runs independently, avoiding interference and improving reliability.
Best Practices
To get the most out of Jest:
- Test how components behave rather than focusing on implementation details.
- Use
beforeEachto set up shared conditions for tests. - Keep tests deterministic to avoid flaky results.
- Commit snapshot files with your code to track UI changes.
"Unit testing is the secret ingredient to good code." – Paul Loveridge, Senior Software Developer [20]
Integration Tips
Jest pairs well with React Testing Library for component testing. During development, enable watch mode for instant feedback and use the built-in coverage reporter to ensure thorough testing [22]. This workflow helps catch issues early while maintaining high-quality code.
10. React Testing Library: Component Testing
React Testing Library (RTL) shifts the focus of component testing to how users interact with your application. It emphasizes testing from the user's perspective, aligning with modern practices and prioritizing accessibility.
Core Testing Philosophy
RTL promotes writing tests that mimic how users interact with your app. As Kent C. Dodds, the library's creator, puts it: "The more your tests resemble the way your software is used, the more confidence they can give you" [23][24].
Key Features
| Feature | Description | Why It Matters |
|---|---|---|
| DOM-Based Testing | Uses actual DOM nodes | Delivers more reliable results |
| Accessibility Queries | Built-in a11y query support | Helps ensure inclusive design |
| Straightforward API | Easy-to-use query methods | Simplifies the testing process |
| User-Focused | Simulates real user interactions | Leads to more maintainable tests |
Practical Example
Here's a quick example of how RTL works in practice:
import { render, screen } from '@testing-library/react';
import userEvent from '@testing-library/user-event';
import LoginForm from './LoginForm';

test('submits form with user credentials', async () => {
  render(<LoginForm />);

  await userEvent.type(screen.getByLabelText('Username'), 'testuser');
  await userEvent.type(screen.getByLabelText('Password'), 'password123');
  await userEvent.click(screen.getByRole('button', { name: /submit/i }));

  expect(screen.getByText('Login successful')).toBeInTheDocument();
});
This example demonstrates how to simulate user actions like typing and clicking, ensuring your component behaves as expected.
Best Practices
To get the most out of RTL:
- Use role-based queries (e.g.,
getByRole) as your go-to method for selecting elements. - For asynchronous actions, rely on findBy queries.
- Opt for
@testing-library/user-eventinstead offireEventto mimic real user behavior more accurately.
Once you're comfortable with these basics, you can explore more advanced techniques to enhance your tests.
Advanced Strategies
Giorgio Polvara, a well-known developer in the React ecosystem, explains: "React Testing Library doesn't give you any access to the implementation details. It renders the components and provides utility methods to interact with them. The idea is that you should interact with your application as a user" [25].
This approach ensures your tests remain focused on the user experience rather than internal implementation details.
Integration and Performance
RTL works seamlessly with Jest, making it easy to set up and use. By leveraging role-based queries and handling asynchronous tasks effectively, you can create tests that are both resilient and easy to maintain. This makes RTL a popular choice for teams focused on delivering accessible and user-friendly applications.
11. Cypress: End-to-End Testing
Cypress is a popular tool for end-to-end testing, boasting over 5.3 million weekly downloads and 46,000 GitHub stars [26]. By running directly within the browser, it simulates real user interactions, offering developers greater control and visibility during tests.
Core Features and How It Works
Cypress operates alongside your application in the browser's event loop, simplifying network synchronization. This unique approach offers several benefits:
| Feature | Benefit | How It Works |
|---|---|---|
| Auto Wait | Eliminates manual timeouts | Automatically waits for DOM elements |
| Time Travel | Simplifies debugging | Captures visual snapshots of each test step |
| Real Browser Use | Tests in real environments | Operates within the browser natively |
| Flake Prevention | Ensures consistent results | Waits for application events automatically |
Powerful Testing Capabilities
Cypress allows developers to create detailed test suites. Here's an example of a simple authentication test:
describe('Authentication Flow', () => {
  beforeEach(() => {
    cy.task('db:seed') // Reset database state
  })

  it('successfully logs in user', () => {
    cy.visit('/login')
    cy.get('[data-testid="username"]').type('testuser')
    cy.get('[data-testid="password"]').type('securepass123')
    cy.get('[data-testid="login-button"]').click()
    cy.url().should('include', '/dashboard')
  })
})
This setup is flexible and can easily scale to more complex testing scenarios, including integration with cloud-based tools.
Cloud Integration and CI/CD Workflows
Cypress Cloud takes testing to the next level by streamlining development workflows. Key features include:
- Test replay with video recordings for detailed analysis.
- Smart orchestration to optimize test execution.
- Automated flake detection to identify and address inconsistencies.
- Branch review tools for easier collaboration and insights.
These integrations make it a strong choice for developers working in continuous integration/continuous delivery (CI/CD) environments.
Developer Feedback
The developer community appreciates Cypress for its ease of use and reliability. Hakim El Hattab shares:
"Cypress makes me feel about 10x as confident in my work. Just look at those tests go" [26]
Performance and Debugging
By running directly in a real browser, Cypress ensures fast execution, dependable results, and excellent debugging tools. It's particularly effective for teams working with React applications. Franck Grenier highlights:
"Cypress is a real game changer in e2e testing... Also mention the amazing test runner tool. @Cypress_io beats them all!" [26]
12. Storybook: UI Component Workshop

Storybook simplifies UI component development by providing an isolated environment for creating and testing components. With Version 8.5 now supporting React 19, it aligns perfectly with modern development needs.
Building Components in Isolation
Storybook's isolated workspace is perfect for component-driven development. Here's a quick look at what it offers:
| Feature | Purpose | How It Works |
|---|---|---|
| Isolated Testing | Develop without external dependencies | Components run in a standalone setup |
| Visual Testing | Spot regressions easily | Browser-based manual and automated checks |
| Performance | Speedy test execution | 89 tests complete in under 10 seconds |
| Coverage | Broad testing support | Includes functional, visual, and a11y tests |
This setup allows developers to focus on building and refining components without distractions, making the entire process more efficient.
Tools for Interactive Development
Storybook offers a range of tools for building and testing components. Here's an example of a simple story setup:
// Button.stories.jsx
export default {
  title: 'Components/Feedback/Button',
  component: Button,
  parameters: {
    controls: { expanded: true }
  }
};

export const Default = {
  args: {
    label: 'Click Me',
    variant: 'primary'
  }
};
This format makes it easy to create, test, and tweak components interactively.
Testing and Documentation Combined
Storybook's testing features integrate seamlessly with React workflows. Key capabilities include:
- Component Testing: Quick, browser-based tests that feel as fast as unit tests.
- Visual Regression: Automatically detects UI changes across different states.
- Accessibility Testing: Built-in tools ensure compliance with upcoming 2025 accessibility standards.
- Network Mocking: Simulates various API responses for realistic testing scenarios.
Real-World Success Stories
Brad Frost, author of Atomic Design, highlights the platform's strength:
"Storybook is a powerful frontend workshop environment tool that allows teams to design, build, and organize UI components (and even full screens!) without getting tripped up over business logic and plumbing." [28]
Take Mealdrop, for example. They achieved full test coverage for 45 components using Storybook's testing features [27].
Staying Ahead in 2025
With the European Accessibility Act set to take effect in June 2025 [29], Storybook's accessibility tools are more important than ever. Addons like Controls and Actions allow developers to create interactive examples and manage events, while the Docs addon ensures detailed documentation is always at hand.
Taurie Davis, author of Building Design Systems, shares:
"Storybook has made developing components more streamlined by allowing us to easily include technical documentation within our design system!" [28]
13. ESLint: Code Quality Checker
ESLint plays a critical role in React development, ensuring your code is clean and dependable. By analyzing your code using an Abstract Syntax Tree (AST), it helps catch errors early - before they make their way into production.
Key Features
ESLint's capabilities are powered by its AST-based analysis, allowing it to identify a range of issues. Here's a breakdown of its main features:
| Feature | Purpose | How It Works |
|---|---|---|
| Real-time Feedback | Alerts you to issues as you code | Integrated with editors |
| Customizable Rules | Lets you define rules specific to your project | Flexible configurations |
| React-Specific Checks | Validates React-specific patterns and syntax | React plugin support |
| CI/CD Integration | Ensures code quality in automated pipelines | Pipeline-ready setup |
These features simplify maintaining consistent, high-quality code.
Modern React Configuration
The January 2025 release of eslint-plugin-react (v7.37.4) introduced support for new HTML attributes like onBeforeToggle and popoverTarget[31]. Below is an example of a practical ESLint setup tailored for React:
module.exports = {
  extends: [
    'plugin:react/recommended',
    'plugin:react-hooks/recommended',
    'plugin:react/jsx-runtime'
  ],
  plugins: [
    'react',
    'jsx-a11y'
  ],
  rules: {
    'react/jsx-filename-extension': [1, { extensions: ['.jsx', '.tsx'] }],
    '@typescript-eslint/naming-convention': 'error',
    'import/no-default-export': 'error'
  }
}
Streamlined Development Workflow
This configuration integrates smoothly into development processes. As Tim James put it, "Using the rules above will improve your code quality, consistency, and reduce the risk of bugs."[30] ESLint helps by identifying unused variables, undefined props, enforcing consistent formatting, and validating JSX syntax and accessibility standards - all of which contribute to a smoother workflow.
Accessibility Made Simple
The eslint-plugin-jsx-a11y is a must-have for teams focused on accessibility. It automatically checks JSX markup against WCAG guidelines, making it easier to build applications that are inclusive and user-friendly. This ensures your React projects meet accessibility standards without added complexity.
14. Prettier: Code Formatter
Keeping a consistent code style is crucial for React projects, and Prettier makes this process effortless. With over 83% of developers using it for React development [32], it’s a trusted tool for automating code formatting.
What Prettier Does
Prettier automatically reformats code based on predefined rules, supporting languages like JavaScript, JSX, TypeScript, CSS, and HTML [32]. Here’s what it standardizes:
| Feature | What It Does | Why It Matters |
|---|---|---|
| Line Length Control | Wraps code automatically | Makes code easier to read |
| Consistent Spacing | Ensures uniform indentation | Keeps the codebase clean |
| Quote Standardization | Standardizes quote usage | Reduces inconsistencies |
| JSX Formatting | Structures components neatly | Improves maintainability |
Easy Integration into Your Workflow
Prettier is simple to set up with a .prettierrc file. Here’s an example configuration:
{
  "semi": true,
  "tabWidth": 2,
  "printWidth": 80,
  "singleQuote": true,
  "trailingComma": "es5",
  "bracketSpacing": true,
  "jsxBracketSameLine": false
}
This straightforward setup not only simplifies individual workflows but also ensures that teams adhere to the same coding standards, boosting collaboration.
Why Prettier Stands Out
Prettier helps resolve formatting debates by enforcing consistent styles across your codebase. With over 9.2 million GitHub repositories relying on it [32], many teams even integrate it into their CI/CD pipelines using commands like prettier --check . to catch formatting issues automatically.
Working Alongside ESLint
Prettier focuses solely on formatting, while ESLint tackles code quality. To avoid conflicts, the eslint-config-prettier package ensures they work together seamlessly [33]. This combination offers a complete solution for maintaining both code quality and style consistency.
15. Vite: Build Tool
Vite is changing the way developers work with React by offering faster builds and a smoother workflow. Built on modern web technologies, it tackles common issues found in traditional bundlers with a fresh approach.
Performance Metrics That Matter
Vite outperforms tools like Webpack in both speed and memory usage, as shown in these benchmarks:
| Project Size | Vite Dev Server Start | Webpack Dev Server Start | Memory Usage (Vite/Webpack) |
|---|---|---|---|
| Small (<10 files) | 131ms | 960ms | 30MB / 103MB |
| Medium (50 files) | 139ms | 1382ms | 36MB / 173MB |
| Large (100 files) | 161ms | 1886ms | 42MB / 243MB |
Key Features of Its Architecture
- Pre-bundling Boost: Vite uses esbuild to pre-bundle dependencies much faster - up to 100 times quicker [35].
- Native ESM: It leverages native ES modules, serving source code directly to browsers for efficient bundling [35].
- Smart Caching: Implements HTTP caching with techniques like '304 Not Modified' responses and long-lived headers for dependencies [35].
Real-World Results
In one case, Vite reduced build time from 28.4 seconds to 16.1 seconds, cut server startup from 4.5 seconds to just 390ms, and delivered nearly instant hot module replacement (compared to Create React App's 5-second delays) [36]. These benefits carry over seamlessly into production workflows.
Production Build Performance
Vite's production builds are designed to be fast and efficient, optimizing both build time and bundle size:
| Metric | Small Project | Medium Project | Large Project |
|---|---|---|---|
| Build Time | 242ms | 363ms | 521ms |
| Build Size | 142KB | 360.77KB | 614KB |
With over 2.5 million weekly downloads on npm [36], Vite has become a go-to tool for modern React development, offering unmatched speed and efficiency.
16. Next.js: React Framework
Next.js takes React development to the next level by offering advanced tools for rendering and boosting performance. It builds on React's foundation, providing out-of-the-box features that simplify development and improve efficiency. With its smart architecture, it delivers faster and more optimized experiences.
Performance Features
Next.js enhances performance with its flexible rendering options:
| Rendering Type | Use Case | Benefits |
|---|---|---|
| Server-Side Rendering (SSR) | Dynamic content | Improves SEO and speeds up the initial page load |
| Static Site Generation (SSG) | Static content | Maximizes speed while reducing server demand |
| Incremental Static Regeneration (ISR) | Mixed content | Combines speed with up-to-date content |
Developer-Friendly Tools
The framework simplifies workflows by automating key tasks. It handles code splitting for you, optimizes images with the next/image component, and uses file-based routing to make navigation setup a breeze.
Standout Features
- Image Optimization: Automatically resizes images, supports modern formats, and includes lazy loading for better performance.
- API Routes: Lets you create backend endpoints directly within your project, no extra server needed.
- Fast Refresh: Keeps your app updated in real-time during development without losing component state.
- Environment Variable Handling: The
NEXT_PUBLIC_prefix ensures client-side variables stay secure.
"Next.js has been a game-changer for our agency work and team collaboration. Its powerful features have allowed us to build high-performance websites quickly and efficiently like never before." - Daniel Lopes, Frontend Developer [37]
These features work together seamlessly, making development faster and easier.
Whether you're working on a small app or a large-scale project, Next.js is designed to handle it all. Its built-in tools and optimizations help reduce the time and effort spent on development.
Conclusion
Choosing the best React developer tools depends on your project's needs and your team's workflow. The right tools can improve both development speed and code quality.
Project-Based Selection
Your project's size and complexity should guide your tool choices. For large-scale applications, tools like Redux for state management and Material UI for components provide the scalability required. On the other hand, smaller projects can benefit from simpler options like Zustand or Chakra UI, which offer ease of use without losing functionality.
| Project Size | State Management | UI Library | Testing Framework |
|---|---|---|---|
| Small (<5 developers) | Zustand/Jotai | Chakra UI | React Testing Library |
| Medium (5-15 developers) | Redux Toolkit | Mantine UI | Jest + RTL |
| Large (15+ developers) | Redux + Middleware | Material UI/Ant Design | Jest + Cypress |
This breakdown helps ensure the tools align with your project's demands.
Integration Strategy
Proper integration of tools is just as important as the tools themselves. Implementing automated linting and code quality checks can reduce bugs and streamline the development process, saving up to 30% of code review time each cycle [38].
Performance Optimization Focus
When it comes to performance, the right debugging tools are key. For example, Why Did You Render helps identify unnecessary re-renders, while React Developer Tools provide detailed performance insights. For more complex projects, combining multiple tools can create a robust debugging setup. This approach ensures your performance strategies work seamlessly with your state management and testing tools.
Preparing for the Future
As React continues to evolve, your toolchain should remain flexible. Look for tools with strong community support, easy integration into your current workflows, and scalability for future growth. The learning curve for your team is also an important consideration.
"Next.js has been a game-changer for our agency work and team collaboration. Its powerful features have allowed us to build high-performance websites quickly and efficiently like never before." - Daniel Lopes, Frontend Developer [37]
Staying competitive in React development requires balancing advanced features with practical, maintainable practices. Regularly review and update your toolchain to keep up with the ever-changing React ecosystem.